In an early 50YearTrader post I talked about charts (Notes on Chart Patterns). One of the points I made is that the time frames (5m, 15m, 30m, 1h, 4h, 1d, 1w) are not in exact correspondence with the 1-2-3 buyer-seller struggles going on at multiple price levels. Essentially, charts are an artificial construction. They are not perfect, but they are what we have to work with in trading Goodman.
I suppose the perfect chart would be a 5m chart 100 feet long. The trader would sit in a chair on rollers so he could zoom back and forth!
Sidebar: This issue, the totality of the buyer-seller struggles versus time frames, reminds me of “strategy” and “tactics” in chess. In chess there are only moves (the totality), but the division into strategy and tactics (time frames) helps our brain work with it. But do not get me started on my epistemology soapbox either.
A GBPUSD Molokai Across Time Frames
Sometimes something shows at one time frame but does not show as well, or at all, on a nearby one. This GBPUSD Molokai is a case in point. The rules for trading a Molokai state that you enter as soon as prices close back in the main body of the Setup.
Counts on the Back Matrix are OK. It is a LITS Molokai (Low in the Saddle), so that is a positive overlay.

At 5h you can see the nice Jumbo Swing. The astute Goodman trader will notice the grouping of bars at the bottom in the green circle, and the little red “tail” bar. That is an indication there might be a Molokai at a lower time frame, so down we go.
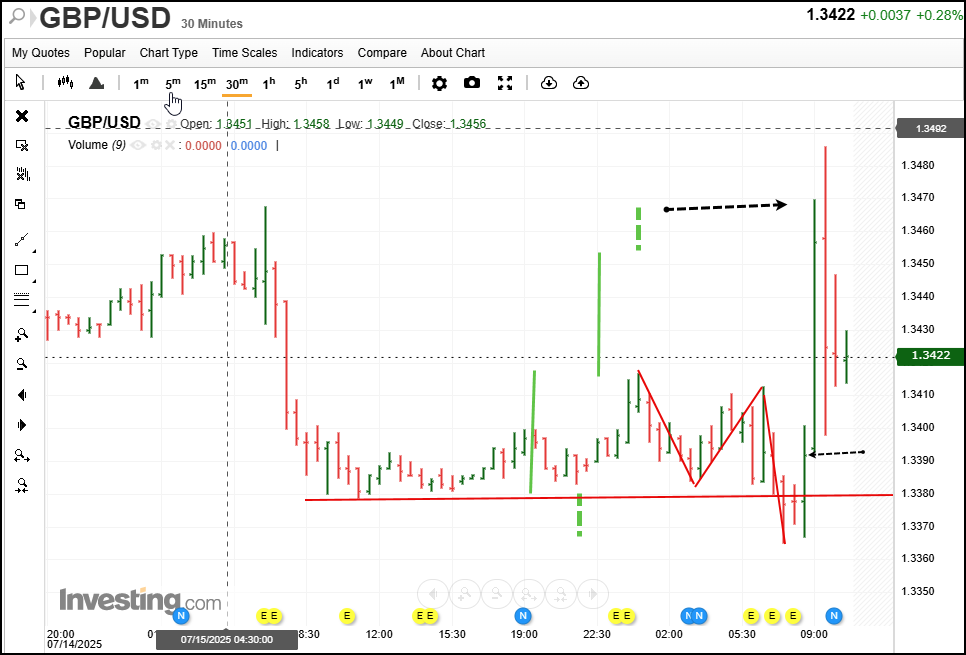
At 30m you can see the Setup fairly clearly. If you traded off the 30m chart, “Danger, Will Robinson!” The close is right on the border of being too far into the body and messing up the risk/reward ratio.
The Two Ledgers of a Trade
Sidebar: In the Goodman Method there are two “ledgers” the trader uses to evaluate a trade candidate:
- The Setup and its various properties and overlays.
- The risk/reward ratio (initial stop-loss to Under take-profit).
There is some play available in your decision. For example, a “toe curler” Setup can accommodate a less-than-ideal R/R, and an outstanding R/R (think Micro-Nest!) can accommodate a less-than-perfect Setup. Charlie said, “No single factor can make or break a trade candidate.” It is the balance of all things that decides.
(I am also showing the Take Profit count for the Under objective on a Molokai Setup with the 30m chart.)
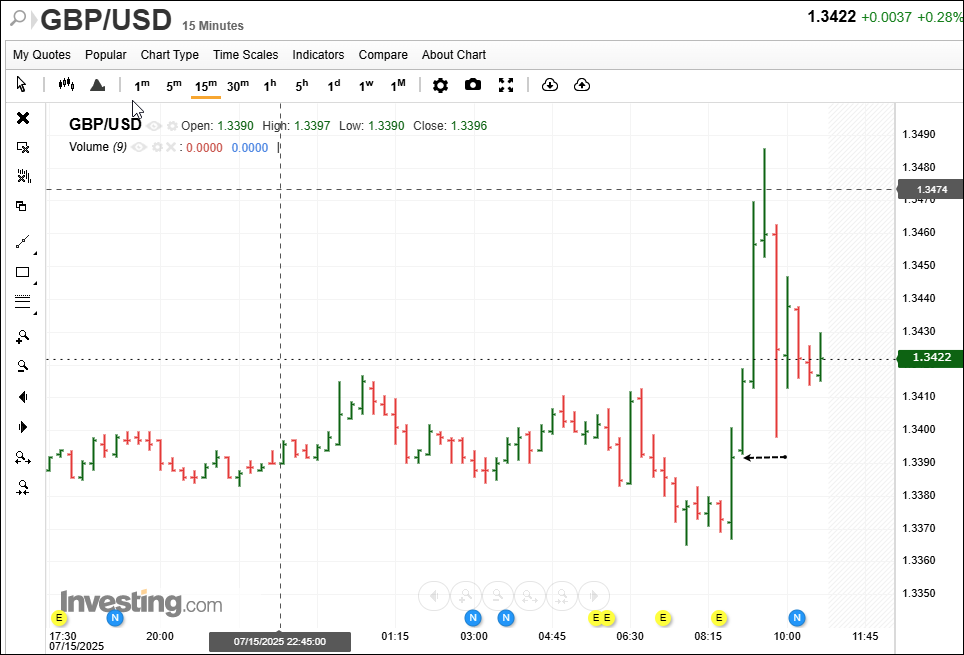
But if you traded off the 15m chart, there is just enough more to make it all systems go and no worries.
This post is educational commentary. It is not investment advice. Trading futures and FX involves substantial risk of loss.
Good Trading!
Michael Duane Archer
Related Reading
- The Goodman Return Point: A Quick Butterfly Trade
- Open Interest as a Goodman External Overlay: The 8 Rules
- Goodmanisms: Charlie Goodman’s Sayings on Trading, Explained
Keep Learning the Goodman Way
If this article was useful, these are the next steps:
- The Method: propagation, intersection and the 3-C Principle, drawn plate by plate.
- The Goodman Library: the books, from Goodman for Grasshoppers to The Goodman 6 & 6.
- The Trader’s Playbook: the Molokai setup in one printed, numbered volume.
- Mentoring: work one-on-one with the authors.