Excerpted from the Goodman Playbook.
The Nest
A Nest is a Setup (Goldilocks or Molokai/6 & 6) which forms at the end of a larger Setup (Goldilocks or Molokai/6 & 6).
The Back Matrix of the Setup becomes the Jumbo for the nest. TIP: The normal “Room to Run” rule does not hold for Nest Jumbos.
Thus, there are four possible Nests: Goldilocks to Goldilocks, Goldilocks to Molokai, Molokai to Molokai and Molokai to Goldilocks. Here is a schematic of a Goldilocks to Goldilocks Nest:

Charlie said, “A nest is best by test.” See my post on the Goodman Paradigm for why the trader wants as many buyer-seller struggles (at multiple price levels) as possible pointing in the same direction. Clearly, a nest meets that criterion.
The Micro-Nest
A Micro-Nest occurs when a Setup forms at the end of the nest.
Typically, one needs to find these on multiple time-frame charts. Experienced Goodman traders can see potential ones on a single time-frame chart, then refine the search by looking at lower time-frames.
As an example, one could have a Molokai-to-Molokai-to-Molokai Micro-Nest. (Thanks for this to my ace student, Mohammed Ahmed.)

Micro-Nests do not occur with great frequency, but they are, per Charlie, “high percentage sitting ducks!”
A Micro-Nest on the EURNOK
Here is a Micro-Nest on the EURNOK using the 5-hour, 1-hour and 30-minute charts:

On the 5-hour chart you can see the Molokai-to-Molokai nest. To keep it simple I have not drawn in all the 1-2-3s. Nor have I done the 3-C counts, which Goodman traders would certainly do, at least on the Back Matrix of both setups.
Now, let’s look at the small grouping of bars indicated above with the black arrow:

Yes, a Micro-Nest Molokai at the end of the Nest. Here is a better look at it on the 30-minute chart:
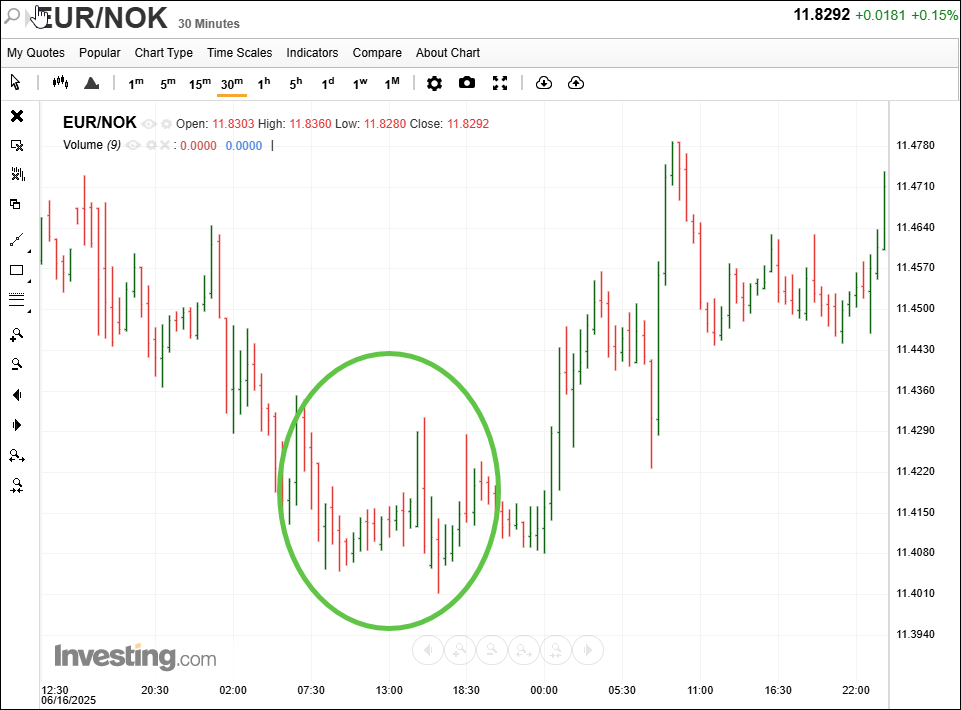
Seeing Setups Across Time Frames
Again, experienced Goodman traders can see a grouping of bars at one time-frame and recognize it may well be a Setup at a lower time-frame. For example, a grouping of five or six bars forming a parallelogram at 1-day usually signifies there is a setup at 1-hour.
TIP: It helps to have two or preferably three monitors so you can see time-frames side by side. Some trading programs allow a split-screen view of multiple time frames. I prefer the multi-monitor approach. To each, his own.
Aside from having buyer-seller struggles at three different levels lined up to go in the same direction, sometimes the smallest nest will “kick in” the larger nest, which will then put the Setup in motion. What is wrong with a 200-pip-plus trade from the Setup with only a 10-pip risk on the Micro-Nest? Sometimes we call this a FireStarter trade.
Charlie always started at the 1-month charts and worked down to 1-day charts. This is certainly the most efficient. Over the years I got in the habit of starting at the lower time-frame and working up. Spoiler alert: Charlie’s approach is better.
Sidebar: Remember, in the 1970s we traded commodity futures for perhaps six hours a day. We had the remainder of the day to analyze the six or seven markets we followed. FX runs 24 x 5, and if you count the Kiwi there are 28 Major Pairs to consider. For us the short-term charts were 1-day.
This post is educational commentary. It is not investment advice. Trading futures and FX involves substantial risk of loss.
Good Trading!
Michael Duane Archer
Related Reading
- The Goodman Nest: Four Setups That Stack the Odds
- The Molokai Setup: What to Do When the Goldilocks Fails
- Goodmanisms: Charlie Goodman’s Sayings on Trading, Explained
Keep Learning the Goodman Way
If this article was useful, these are the next steps:
- The Method: propagation, intersection and the 3-C Principle, drawn plate by plate.
- The Goodman Library: the books, from Goodman for Grasshoppers to The Goodman 6 & 6.
- The Trader’s Playbook: the Molokai setup in one printed, numbered volume.
- Mentoring: work one-on-one with the authors.