“Everything is a 1-2-3” in Goodman Wave Theory.
But the 1-2-3s and Setups can be difficult to see, especially when there is a lot of Time Hash and bar-to-bar overlap (“thickness”). And, once again, the time-frames do not have a perfect one-to-one correspondence with the 1-2-3s and propagations. Of course, as in life, experience is the best teacher. I do show students a few “tricks” or “shortcuts” to speed up the learning process.
The 1-Hour Silver Chart, OHLC
Here is the 1-Hour Silver chart with OHLC bars.

We see a Molokai fail just after it propagated. We are OK, because that is enough to bring stop-losses to Break Even (BE), black arrow. But then comes the ugly Weak Sister.
Then another Molokai forms, but it is extremely difficult to see, and the First Primary Swing (FPS) at this time-frame doesn’t show a 1-2-3.
Sidebar: For fun I placed the Under Count for this little Setup. The Tail is only a few cents.
The Same Chart as a Line Chart
Now here is the line chart:
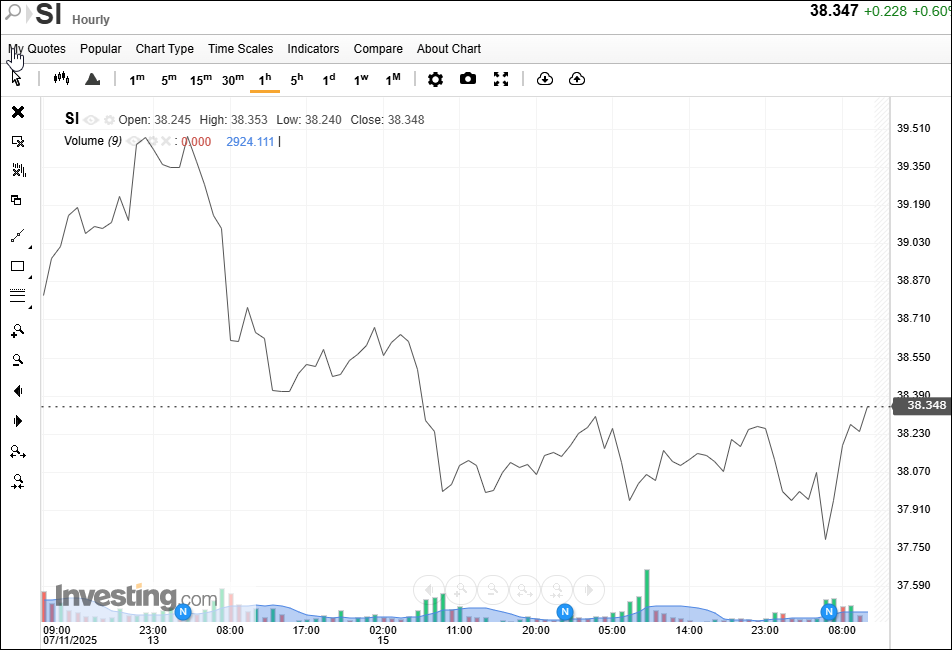
Clear as a bell. The problem with line charts is that doing 3-C counts (important!) becomes harder, and quite a bit of useful information is deleted. But it is sort of like an X-ray view, so if you are learning Goodman and having problems visualizing the Setups, try some line charts.
This post is educational commentary. It is not investment advice. Trading futures and FX involves substantial risk of loss.
Good Trading!
Michael Duane Archer
Related Reading
- The Goodman Nest: Four Setups That Stack the Odds
- Silver Update: Goodman Under Count Objective Met
- Goodmanisms: Charlie Goodman’s Sayings on Trading, Explained
Keep Learning the Goodman Way
If this article was useful, these are the next steps:
- The Method: propagation, intersection and the 3-C Principle, drawn plate by plate.
- The Goodman Library: the books, from Goodman for Grasshoppers to The Goodman 6 & 6.
- The Trader’s Playbook: the Molokai setup in one printed, numbered volume.
- Mentoring: work one-on-one with the authors.