Long-term charts of corn futures are interesting right now. Here is what Goodman traders can see on the 1-month and 1-week charts, and what to watch for next.
The 1-Month Chart
Here is the 1-month corn futures chart:
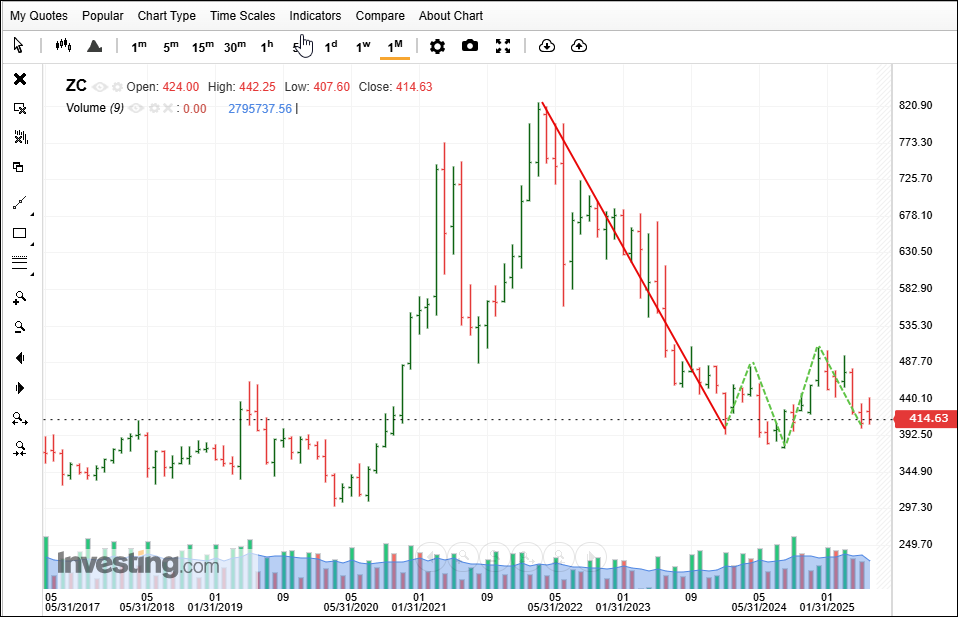
You can see a sweet Jumbo Swing followed by a failed Molokai Setup. (Since it propagated, S/Ls would have been brought to break-even.)
Now we have a Goldilocks forming. Watch the 3-C counts for cancels on the Back Matrix.
The 1-Week Chart
At the 1-week chart, prices are very close to an Under count and a small Return stick.
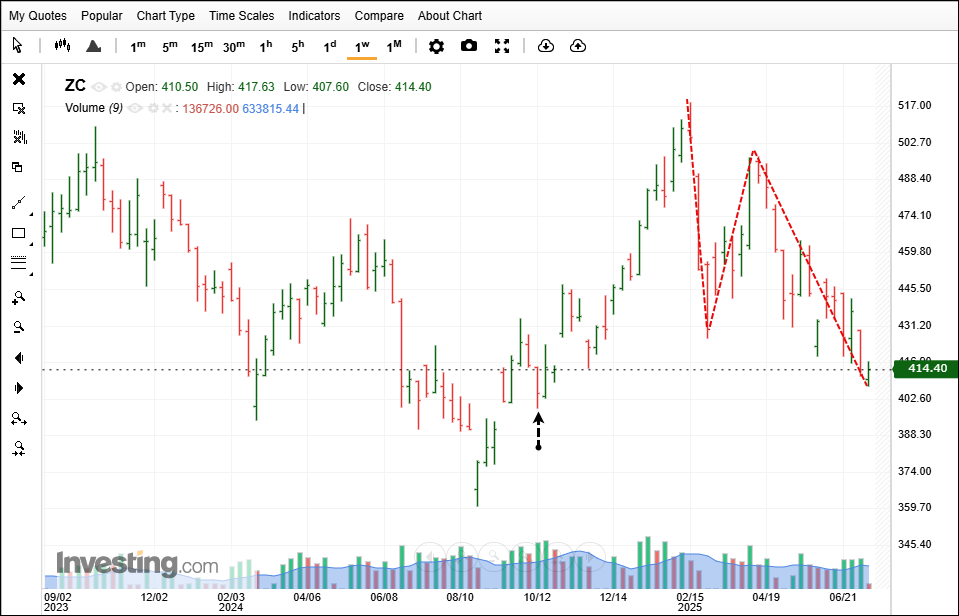
What to Watch Next
Perhaps start watching at 1-hour for a nested Setup? Of course, the Goldilocks now building could also become a large Molokai.
Definitely interesting charts. Tarry awhile.
This post is educational commentary on chart structure using Goodman Wave Theory. It is not investment advice. Trading futures and FX involves substantial risk of loss.
Good Trading!
Michael Duane Archer
Related Reading
- Wheat Futures Chart Analysis: Molokai and Pinch Down
- Soybean Meal Chart Outlook: Inverted Wall & Goodman Knot
Keep Learning the Goodman Way
If this article was useful, these are the next steps:
- The Method: propagation, intersection and the 3-C Principle, drawn plate by plate.
- The Goodman Library: the books, from Goodman for Grasshoppers to The Goodman 6 & 6.
- The Trader’s Playbook: the Molokai setup in one printed, numbered volume.
- Mentoring: work one-on-one with the authors.