I discovered the Reverse Pigtail formation (RPT) about two years ago while ghost trading late at night. It is not particularly common, but it does seem to have the percentages in its favor, with a yummy risk-reward ratio. It seems best on Buy formations and shorter-term bars, 5-minute and 15-minute.
But before I show it to you, let me talk a little about how Charlie viewed chart formations, really the more important topic!
The Buyer-Seller Tug-of-War
I noticed early on that Charlie would see a chart formation quickly, almost instantly, but I would not really recognize it as such. This bothered me (perhaps I had some visual deficiency) until I understood how he thought of such things. Once I discovered that, I became much better at spotting them on the charts!
I also noticed early that in examining a chart Charlie would move a finger slowly along the chart, bar by bar. I believe he was walking through the buyer-seller action in his mind. Occasionally he would lift the finger slightly and then slap it back down on the chart. Charlie thought of everything in terms of the buyer-seller tug-of-war. What this means for identifying chart formations is very important:
A formation may not look perfect visually, but the appropriate buyer-seller action is fully present in it. For example, a Pennant (an old classic chart formation) may not look exactly like a pennant, but the buyer-seller action is still present.
There is an excellent old book on classic chart formations describing them (somewhat) in buyer-seller struggle terms. It was one of the first trading books I read. Alas, discounting has made the classic formations such as head-and-shoulders quite rare; basically, the market discounts the right shoulder and it never forms. BUT if you think in terms of buyer-seller, you may well find one others do not see, because they are looking for the visual formation, not the buyer-seller action. Anyway, the book is How Charts Can Help You in the Stock Market by William Jiler.
Charlie says: “Look for the buyer-seller struggle, not the pretty little chart formation, and you will find gold and silver where others see only dirt and rock!” It’s true. This is a skill which must be developed, and it will require a slower, more careful and proactive examination of a chart. You must find Waldo; he’s not always going to jump out at you. Again, it is the buyer-seller action that creates the formation. It doesn’t always look exactly like its name!
SIDEBAR: Charlie was always interested in the Higher-Lower aspects of BPs and EPs in Setups. I believe this also ties in to his understanding of the buyer-seller paradigm. I wrote an earlier post about this, A Trader’s Bucket List.
“There’s a lot going on in those charts, dad!” Charlie reminded me many times.
Reverse Pigtail Examples
First, here is a very clean and pretty Reverse Pigtail, albeit with a short Jumbo:
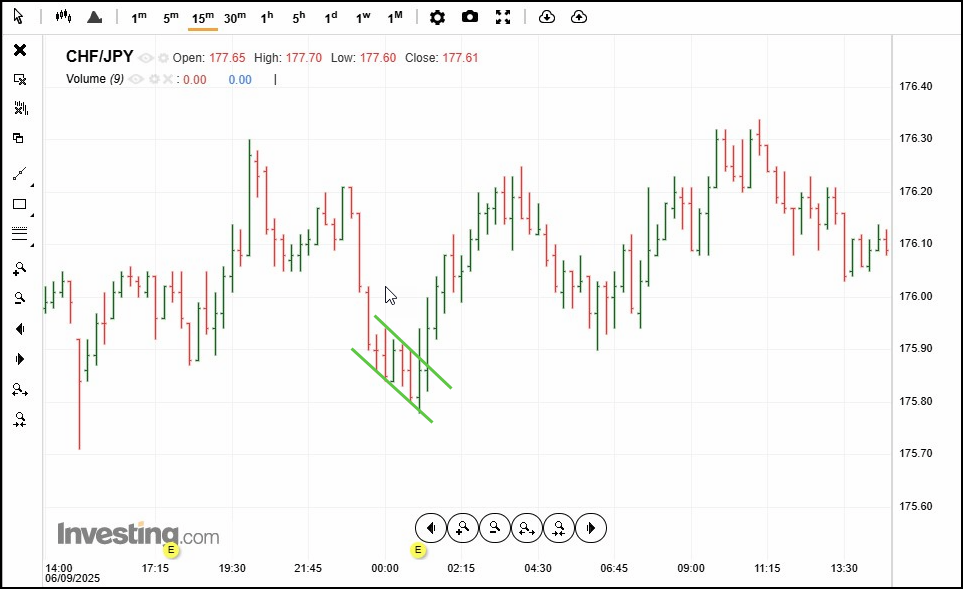
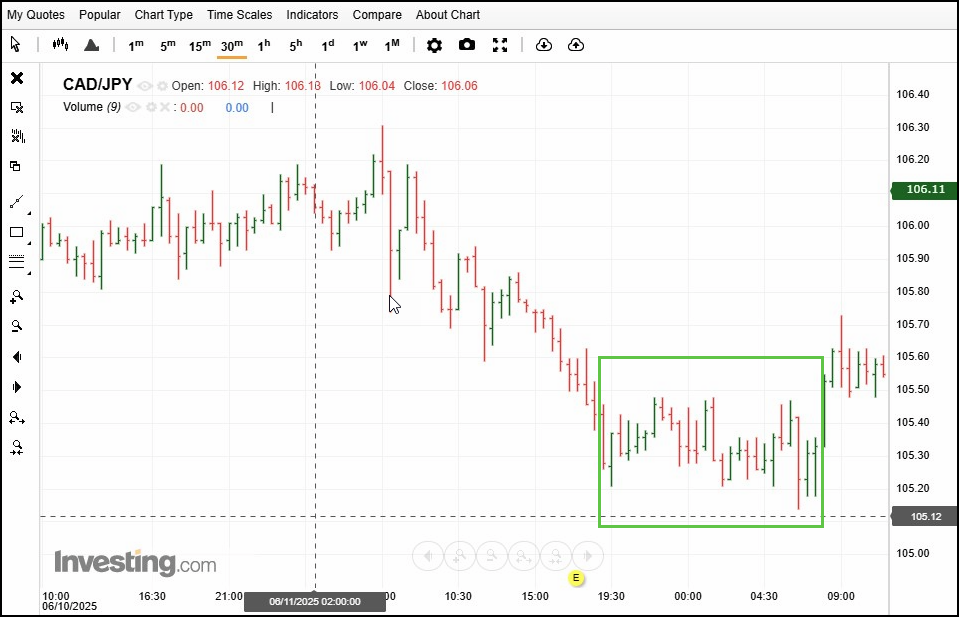
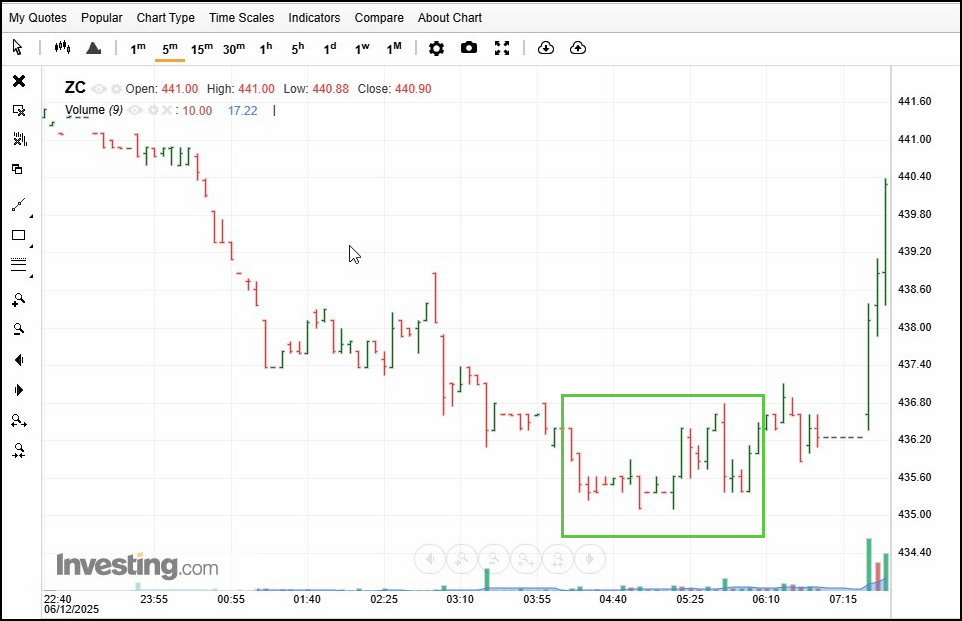
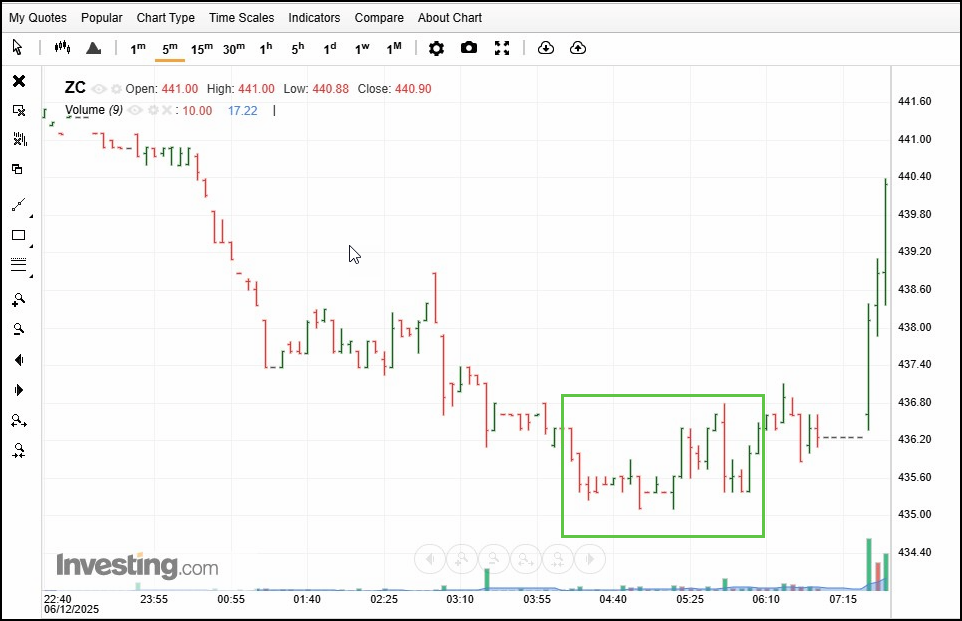
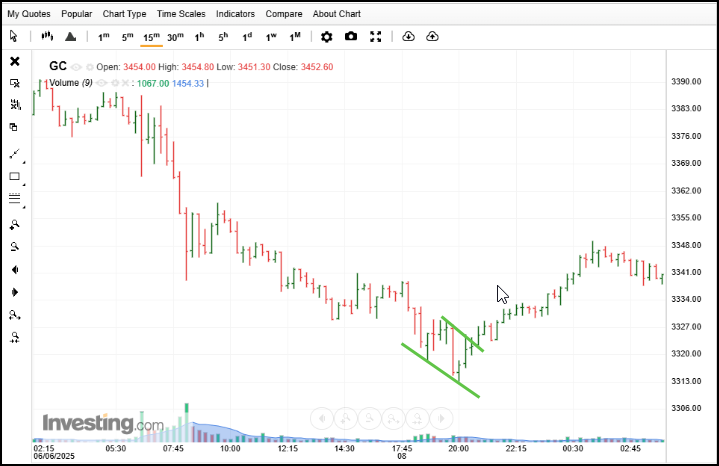
Buy RPTs greatly outnumber Sell RPTs. I assume this is because the volatility at tops makes the required action of sharply shorter bars less likely.
The Buyer-Seller Action That Defines a Buy RPT
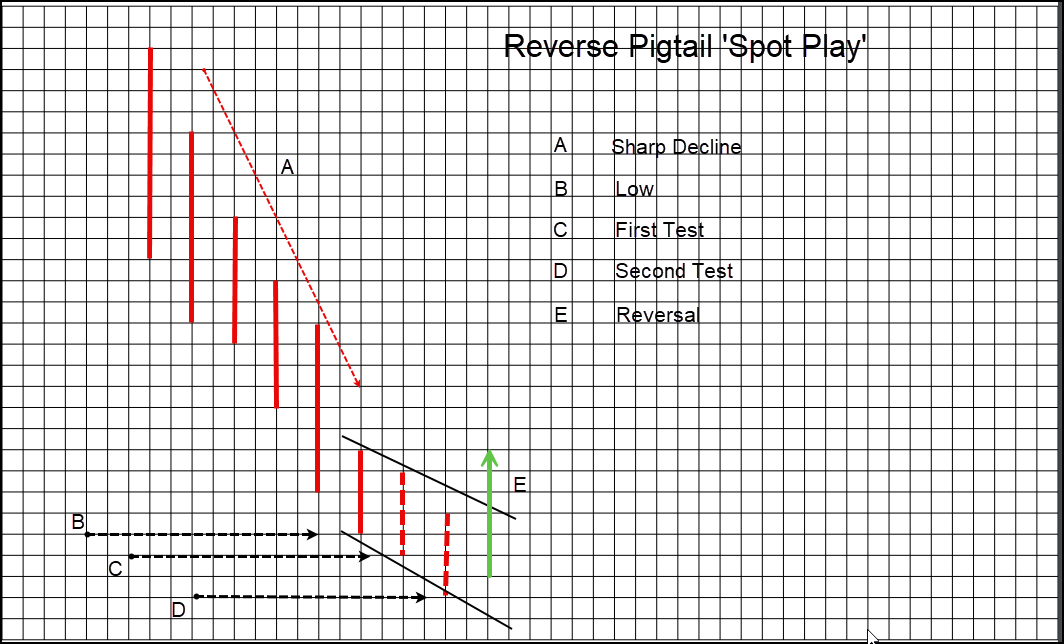
Here is the buyer-seller action defining Buy RPTs:
- Price drops over multiple bars: a Jumbo.
- The length of the bars, relative to the move down, suddenly gets shorter.
- The market rises off the lows.
- The market makes a slightly lower low, or at least touches the previous low.
- The market rises again.
- The market makes a slightly lower new low, or touches the previous (lowest) low.
- The market turns quickly with a longer bar and moves sharply higher.
You can see that the ideal RPT forms a parallelogram, just like a standard Pigtail, but pointed in the opposite direction.
If you just watch for the parallelogram, you will miss some nice trading opportunities! Not so if you are tracking the buyer-seller action as listed above! As you can see, that takes a closer, slower, proactive look at the chart.
Jumbo → Stops → Rises a little → New low → Rises a little → New low → Breakout to upside
Trading the Reverse Pigtail
Generally, you can draw a line across the top of the formation. Yes, it might cut through a bar, but that is OK as long as the buyer-seller conditions are intact. It may take a touch of imagination to see it, but remember the Big Dipper is only composed of seven stars…
Once the top line of your RPT is crossed, you can enter, either on-stop or by waiting for a close above the line. Danger, Will Robinson: sometimes the market really soars quickly after an RPT! Also, I don’t see many Second Chance RPTs. “Run fast or not at all!”
The good news is your risk-reward ratio will be strong on an RPT. Your objective is three times the vertical value of the RPT (Cohen’s P & F measurement) or the TP of the Jumbo, whichever occurs first. If the chart speaks to you otherwise, you can close one-half and Trade the Line with the other half! I trade them mostly off 5-minute FX charts, but certainly the study of the higher time frames might prove profitable.
This post is educational commentary on chart structure using Goodman Wave Theory. It is not investment advice. Trading futures and FX involves substantial risk of loss.
Good Trading!
Michael Duane Archer
Related Reading
- The Pigtail and the Weak Sister: Two Goodman Spot Plays
- The Wall: A Goodman Bottom Formation for a Clean Slate
Keep Learning the Goodman Way
If this article was useful, these are the next steps:
- The Method: propagation, intersection and the 3-C Principle, drawn plate by plate.
- The Goodman Library: the books, from Goodman for Grasshoppers to The Goodman 6 & 6.
- The Trader’s Playbook: the Molokai setup in one printed, numbered volume.
- Mentoring: work one-on-one with the authors.