The Wall is a rare bottom formation that Charlie Goodman identified. It signals that the market is washed out and the trader can start, in effect, with a clean slate. This post explains what it looks like and how to approach it.
Charlie’s Micro and Macro Formations
I’ve mentioned that Charlie identified a number of micro “spot plays,” or formations where the market wiggled its ears a little. I’ve discussed the Weak Sister and the Pigtail, and my meager contribution, the Reverse Pigtail. Perhaps someday I will show the Hidden X / Hidden O in Point & Figure charts.
There were also several larger macro formations he identified. Two of these were the Spread Triples and the Cross Point in GWT. My ace student and Goodman heir, Mohammed Ahmed, has promised me he will explore those in the future. Another was the Diamond Bottom (similar to the Top formation Dines reveals in his How the Average Investor book). In this 50YearTrader post I will show another of them, the Wall. Needless to say, more discoveries are waiting to be made. “There’s a lot going on in those charts, dad!”
What Is the Wall?
The Wall is an indication that the market is washed out and the trader could start essentially with a clean slate, at least in that time frame. Think of it as a variety of Jumbo Swing where you can sit back and watch for a 1-2-3 to build, which then perhaps propagates into a Setup.
How the Wall Forms
The Wall occurs after a market has had a steady, steep decline (it is only a bottom formation), typically accompanied by shorter bars near the end of the decline. The market spikes up for a few bars with much longer bars. Suddenly the market reverses and makes new lows, also with long bars, essentially forming a wall. It then either goes quiet again or starts back up.
Spoiler alert: if it starts back up with longer bars, follow it! Perhaps you can even find a small micro Setup at a lower time-frame to enter.
For whatever reason, I see these (they are not common in any event) more in futures than in FOREX. On the one hand, there are more surprises in FOREX that might cause sudden volatility. On the other hand, the formation may be a consequence of low liquidity. Who knows?
Example: A Wall in Sugar
Here is a Wall in the sugar market that Goodman traders are currently following:
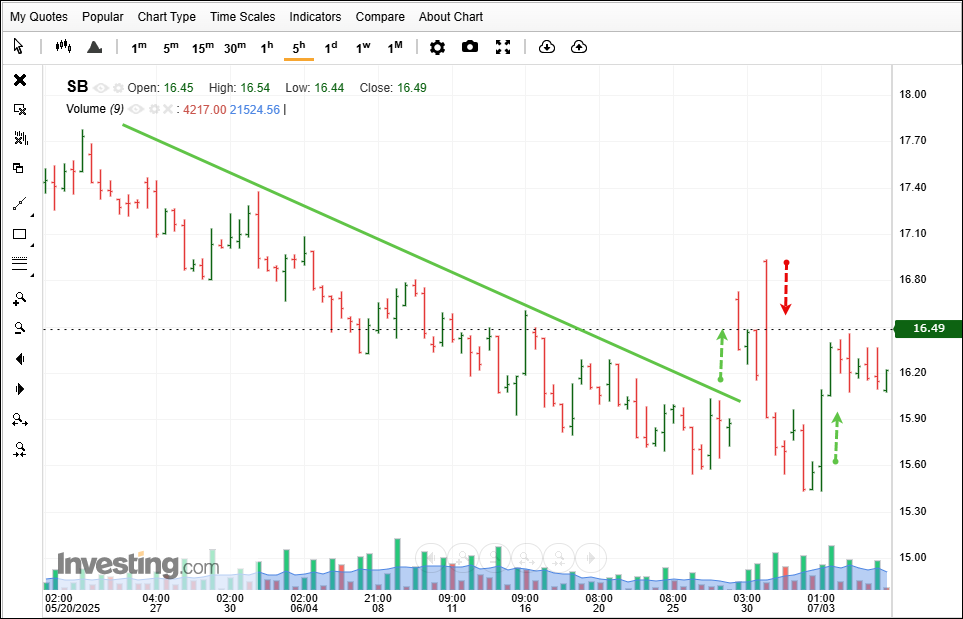
No, sorry, the trendline does not indicate that I use them. I am not denying that the slope of a line is important, but Goodman has the Directional Movement (DM) in Market Environments (ME), which is much more accurate, transferable and quantifiable. Here, the line is just to show the Jumbo.
This post is educational commentary on chart structure using Goodman Wave Theory. It is not investment advice. Trading futures and FX involves substantial risk of loss.
Good Trading!
Michael Duane Archer
Related Reading
- Soybean Meal Chart Outlook: Inverted Wall & Goodman Knot
- Second Chance Entry in Goodman Wave Theory (Don’t Panic)
Keep Learning the Goodman Way
If this article was useful, these are the next steps:
- The Method: propagation, intersection and the 3-C Principle, drawn plate by plate.
- The Goodman Library: the books, from Goodman for Grasshoppers to The Goodman 6 & 6.
- The Trader’s Playbook: the Molokai setup in one printed, numbered volume.
- Mentoring: work one-on-one with the authors.